Automatic Time Binning for Population Pharmacometric Analyses in R
Using the Ckmeans.1d.dp package to perform automatic 1-dimensional data binning.
- Why the Need for Time Binning in Pharmacometric Analyses?
- Overview: 1-Dimensional Data Clustering
- Automatic Time Binning of Pharmacokinetic Data and Generating Summary Statistics
- Visualizing Data Summary Plots in Finch Studio
Why the Need for Time Binning in Pharmacometric Analyses?
For in-vitro experiments performed in the laboratory, it is not too difficult to schedule sampling times and take samples at near exactly the scheduled times. However, for data collected in patients, especially studies conducted in an outpatient settings, it is not always possible or practical to collect pharmacokinetic/efficacy samples at exact time points. This can make it difficult to visualize summary level-data across patients since one can no longer simply generate summary statistics within specific timepoints. Fortunately, we can use automatic time binning methods to group measured timepoints across patients into distinct bins using R.
Overview: 1-Dimensional Data Clustering
1-dimensional data clustering can be defined as the assignment of values in a data vector to n clusters so that the values within a cluster are optimally homogenous. The Ckmeans.1d.dp algorithm accomplishes this by binning values into groups as to minimize the sum of squares within the groups. Unlike heuristic algorithms, the CKmeans algorithm uses a dynamic programming approach that is guaranteed to find the optimal solution. You can find more information on the methods of the algorithm here: https://journal.r-project.org/archive/2011-2/RJournal_2011-2_Wang+Song.pdf
Automatic Time Binning of Pharmacokinetic Data and Generating Summary Statistics
In this post, we'll be simulating pharmacokinetic data. Then, so that we can visualize the mean and standard deviation of concentrations across time, we'll perform automatic time binning to group our timepoints.
Generate the pharmacokinetic data
We're going to use mrgsolve to generate some PK data from a 1-compartment PK model.
Simulating the data
Take a peek at the dataset structure
| time | DV | ID | dose |
|---|---|---|---|
| 0.4842816 | 0.5696984 | 1 | 50 |
| 1.0176670 | 0.9896524 | 1 | 50 |
| 1.9962946 | 1.5227234 | 1 | 50 |
| 2.9889029 | 1.8016925 | 1 | 50 |
| 3.9516264 | 1.9393919 | 1 | 50 |
| 5.9299198 | 2.0146338 | 1 | 50 |
| 8.1420837 | 1.9858405 | 1 | 50 |
| 9.7598111 | 1.9266638 | 1 | 50 |
| 12.4524563 | 1.8599063 | 1 | 50 |
| 14.1431447 | 1.7925812 | 1 | 50 |
Plot the data
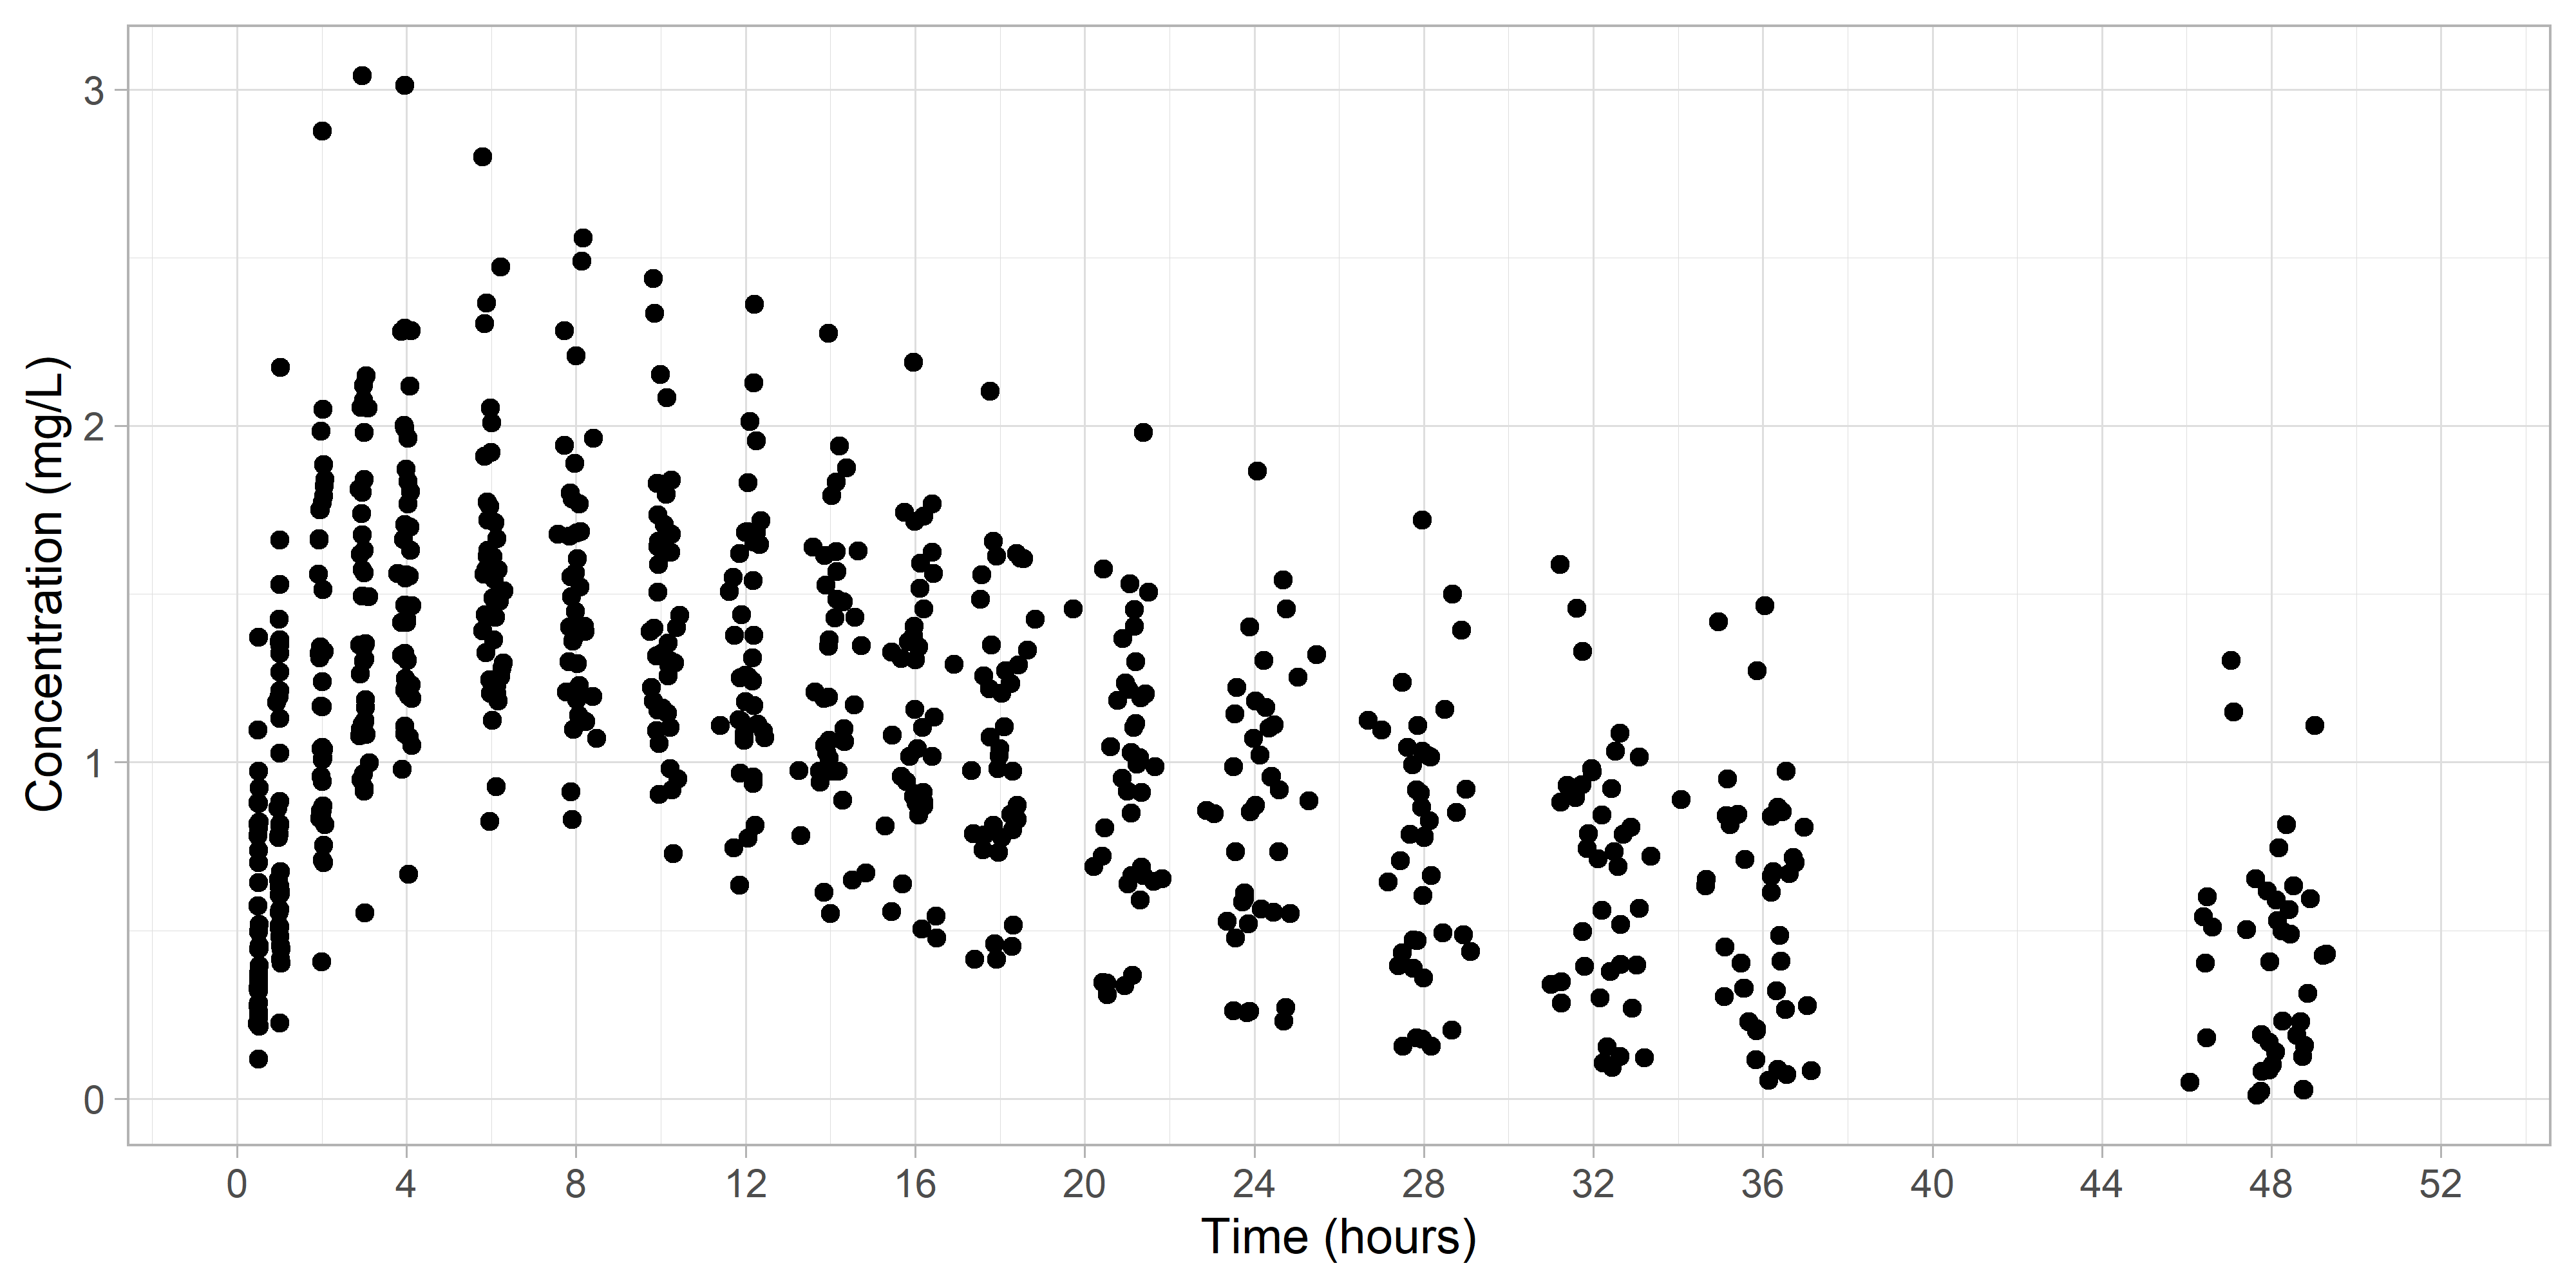
Let's first visualize our raw data.

We can see that naturally the data timepoints are clustered around the scheduled sampling times. Our goal will be to use a statistical-based method to identify the clusters.
Using the Ckmeans.1d.dp package to automatically bin our data
Visualising the Clustered Data
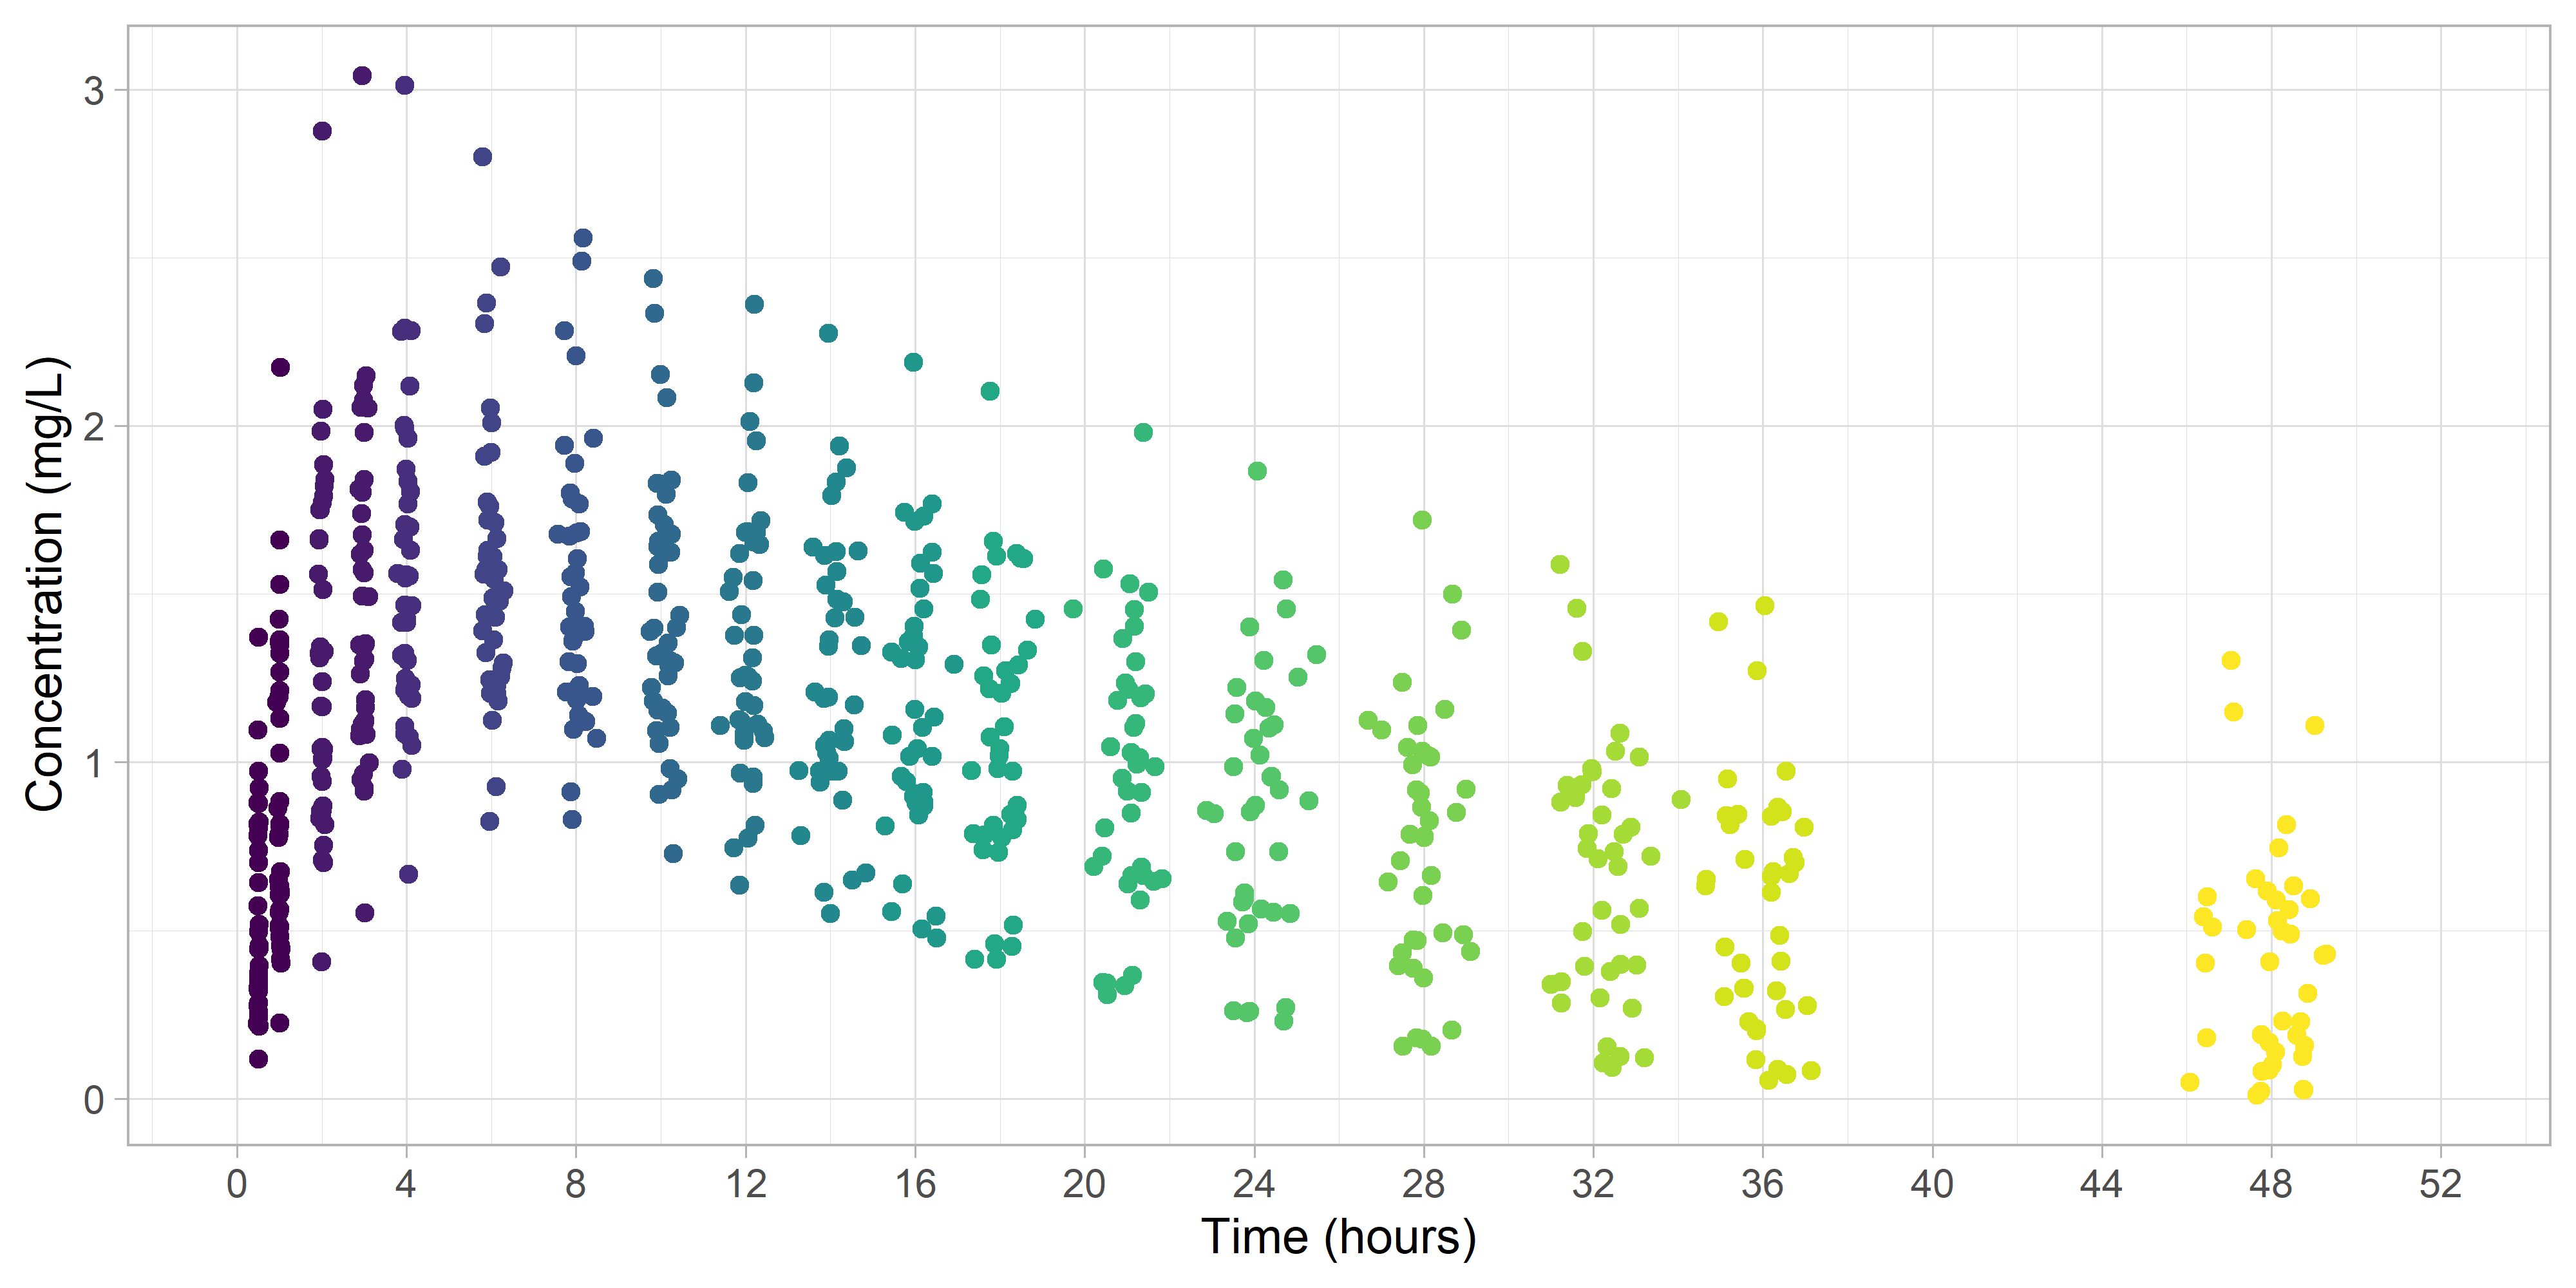
Next, we'll take a look at how the automatic binning performed.

It seems the data were binned into logical groups.
Calculating Summary Statistics
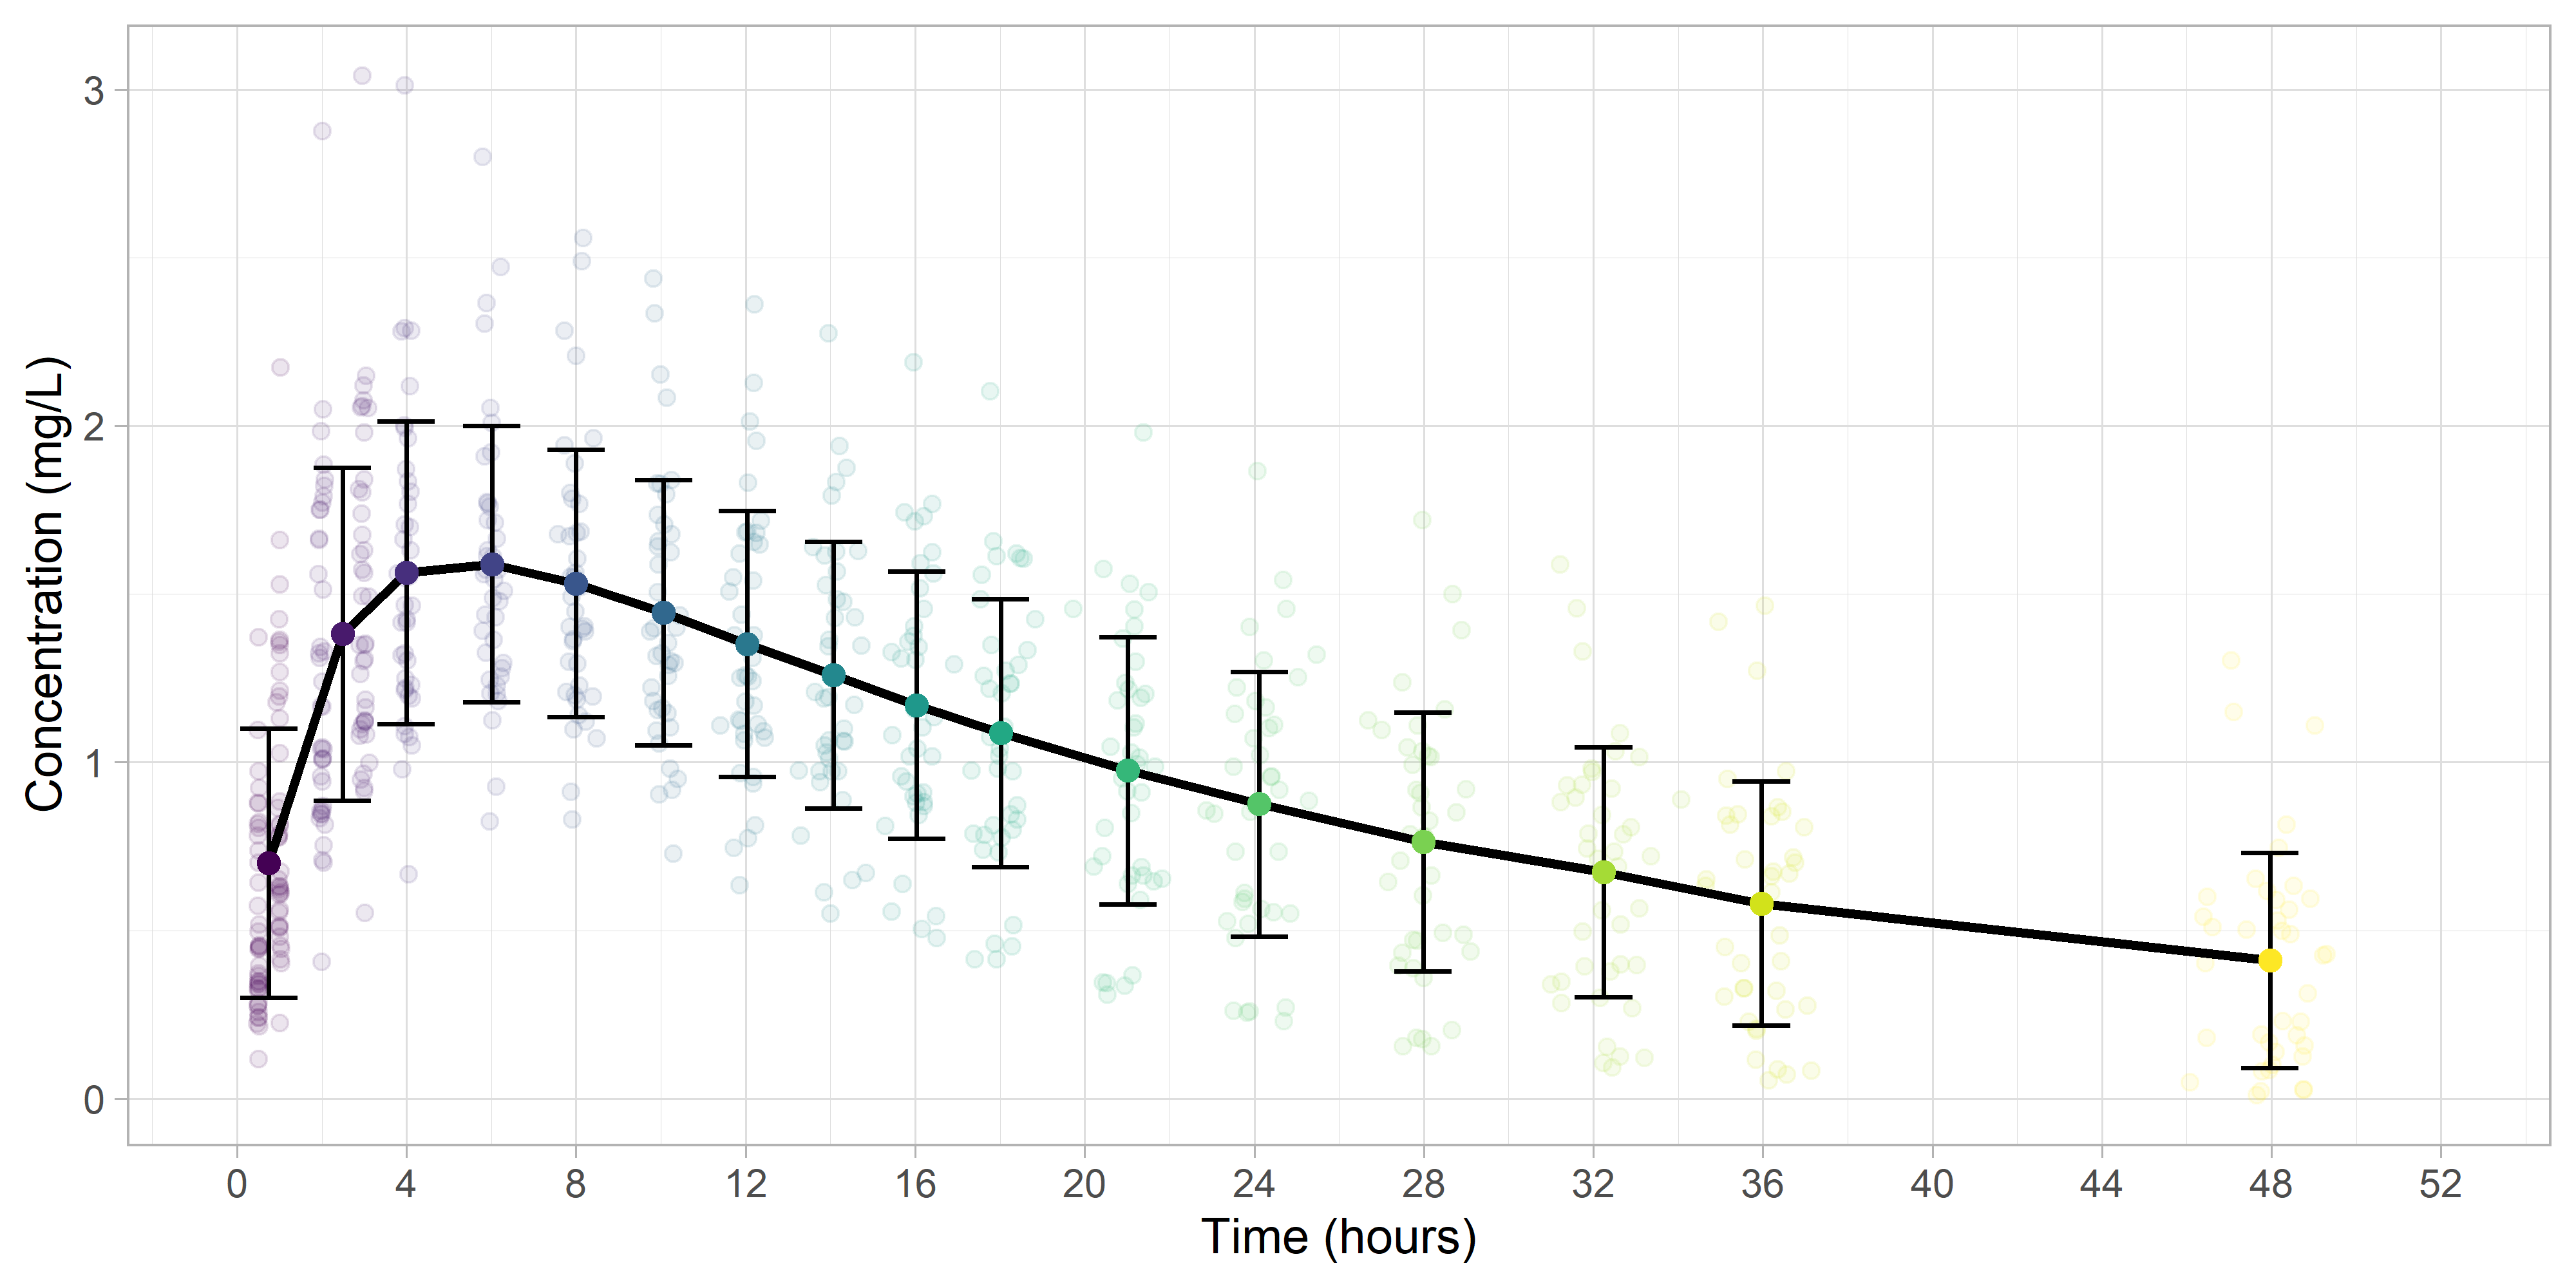
Next, we'll use group_by and summarize to get the summary statistics, and overlay them onto the plot.

Finally, we'll remove the cluster colors.

Visualizing Data Summary Plots in Finch Studio
Wish you had a way to create these mean plots of your NONMEM dataset on the fly? Automatic data binning is built into Finch Studio without the need for any external dependencies. Contact us to learn more about Finch Studio and schedule a demo.