An Integrated Modeling Environment for Pharmacometric Analyses
Bringing Speed, Power & an Unparalleled UI/UX to your Pharmacometric Workflows.
Start TodayWhy Finch Studio?
Finch Studio™ is a comprehensive modeling workbench for pharmacometric analyses. It provides researchers the tools they need to understand their data, build better models, organize their results, and make smart decisions. The intuitive interface is as powerful as it is easy to use, making it ideal for beginners and advanced users alike.
Intelligent Code Editor
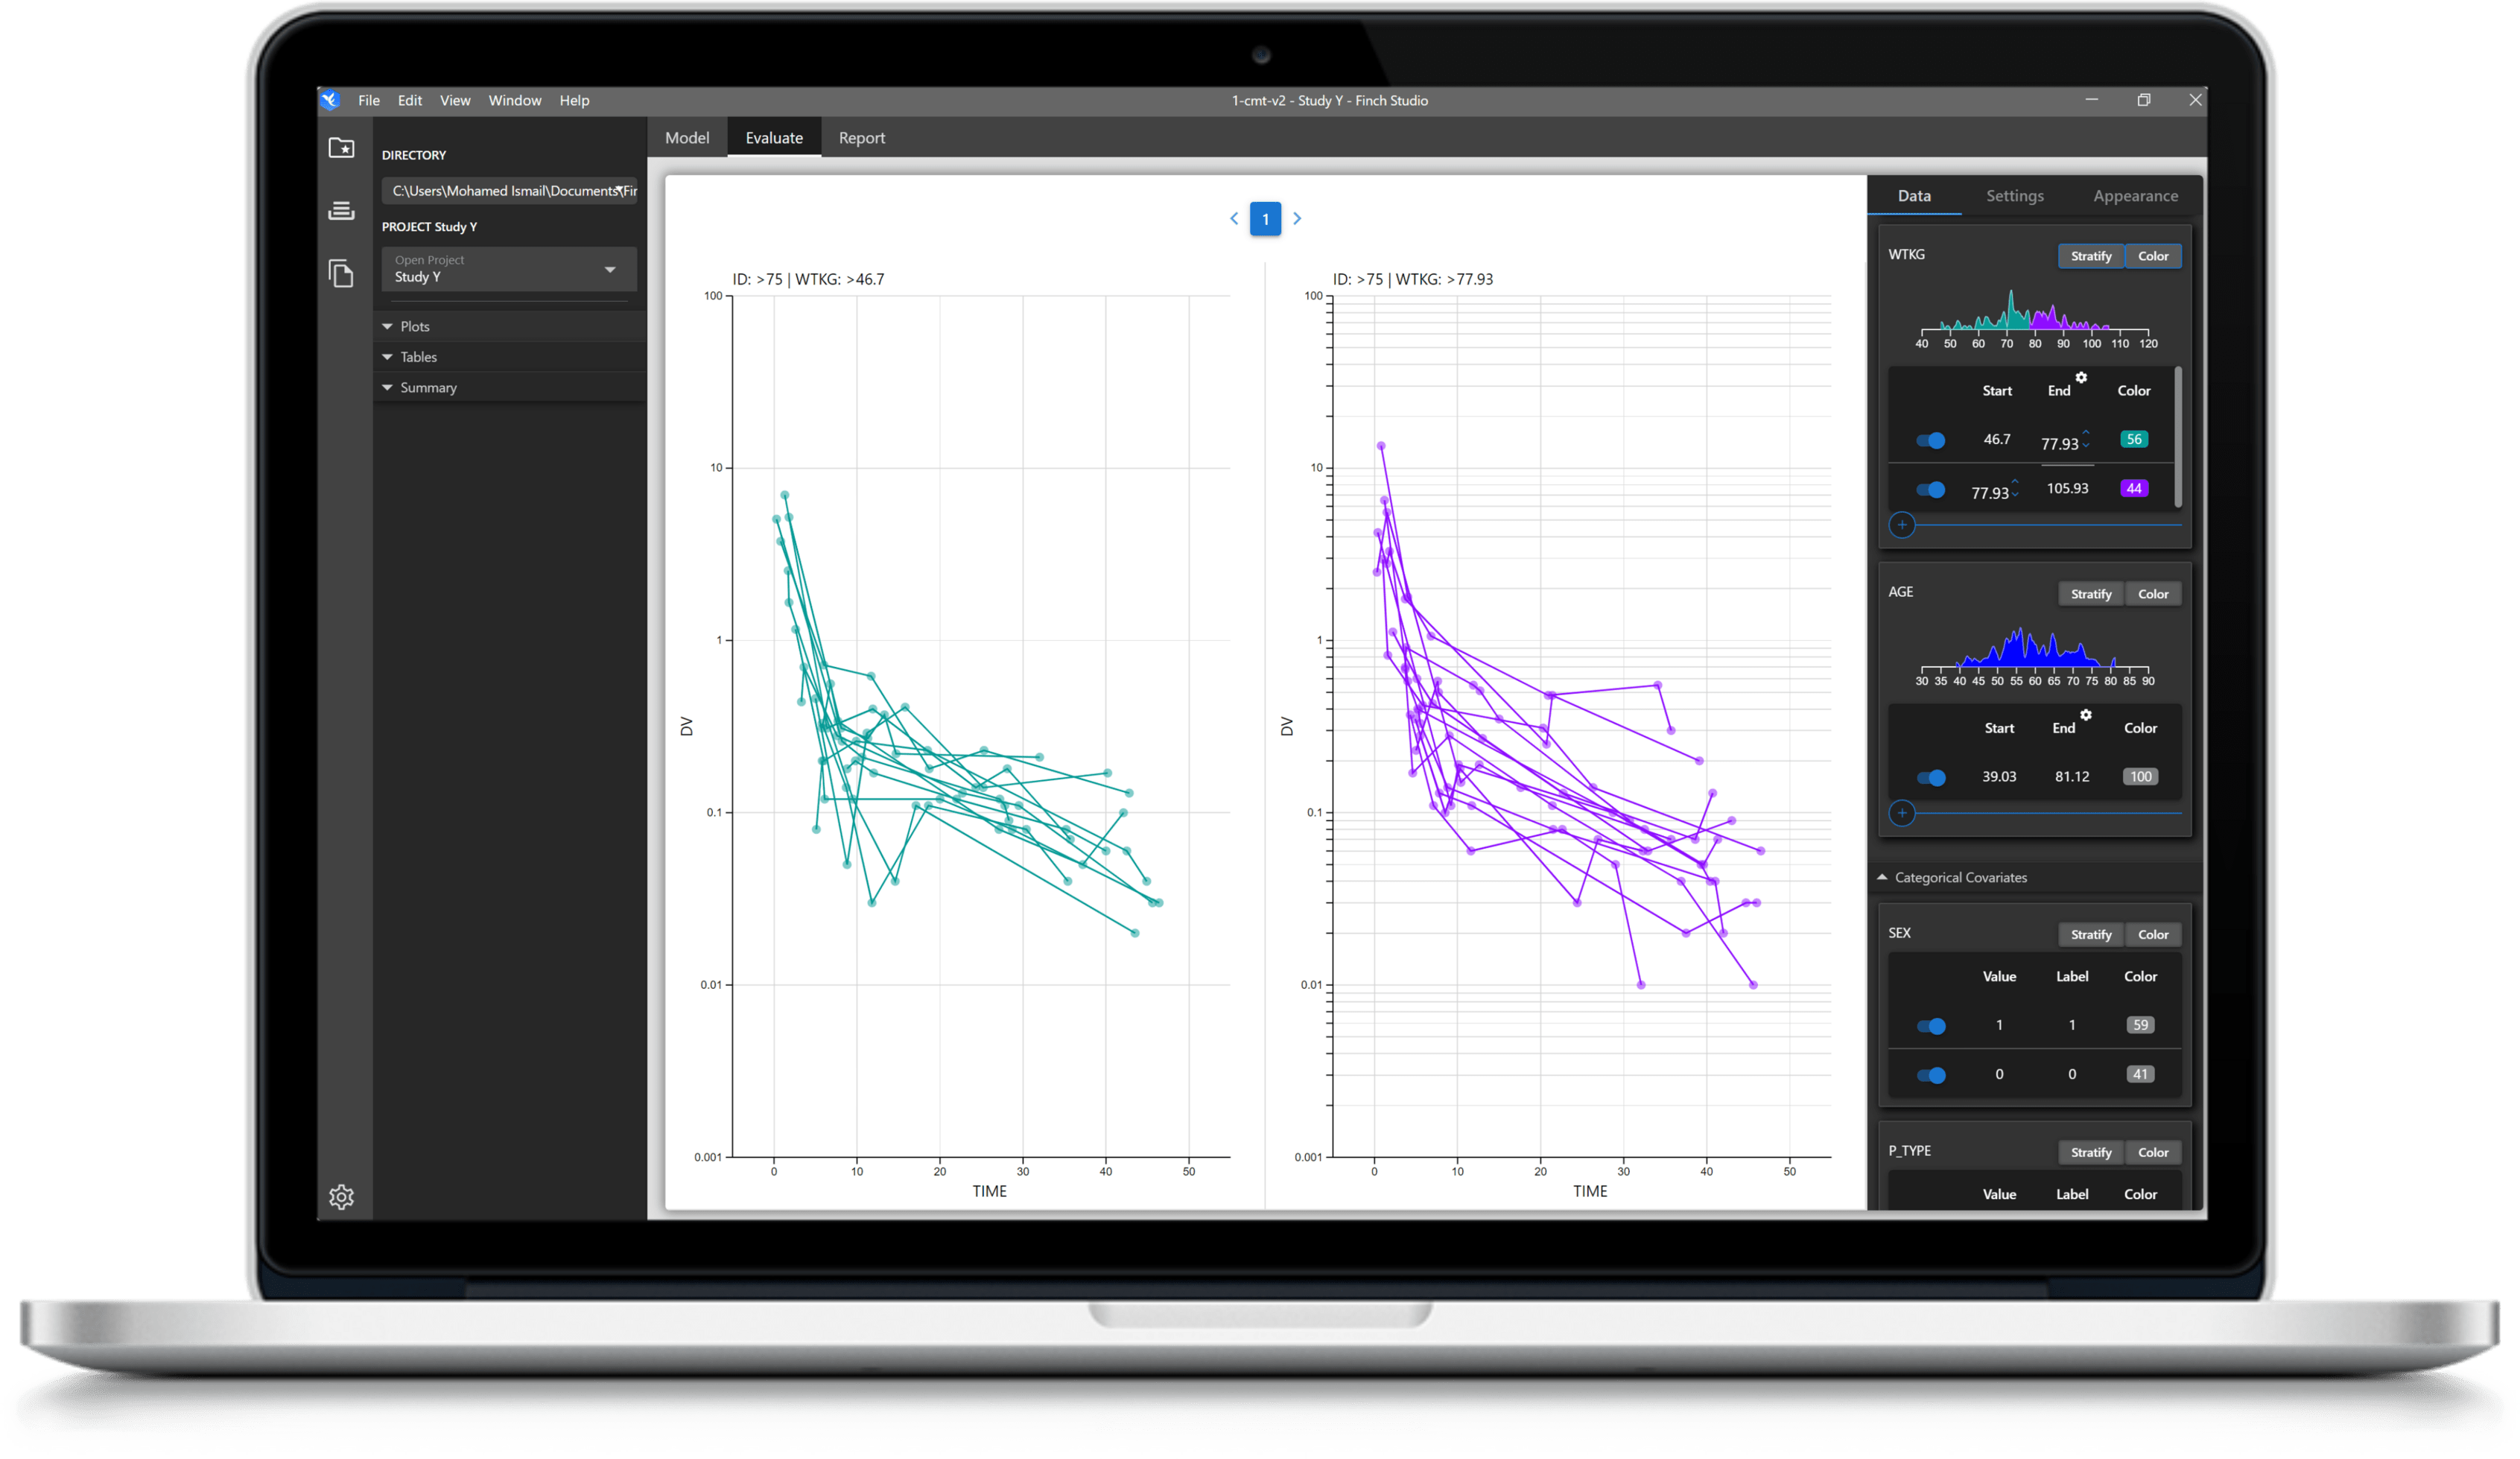
Interactive Visualizations
Model Library
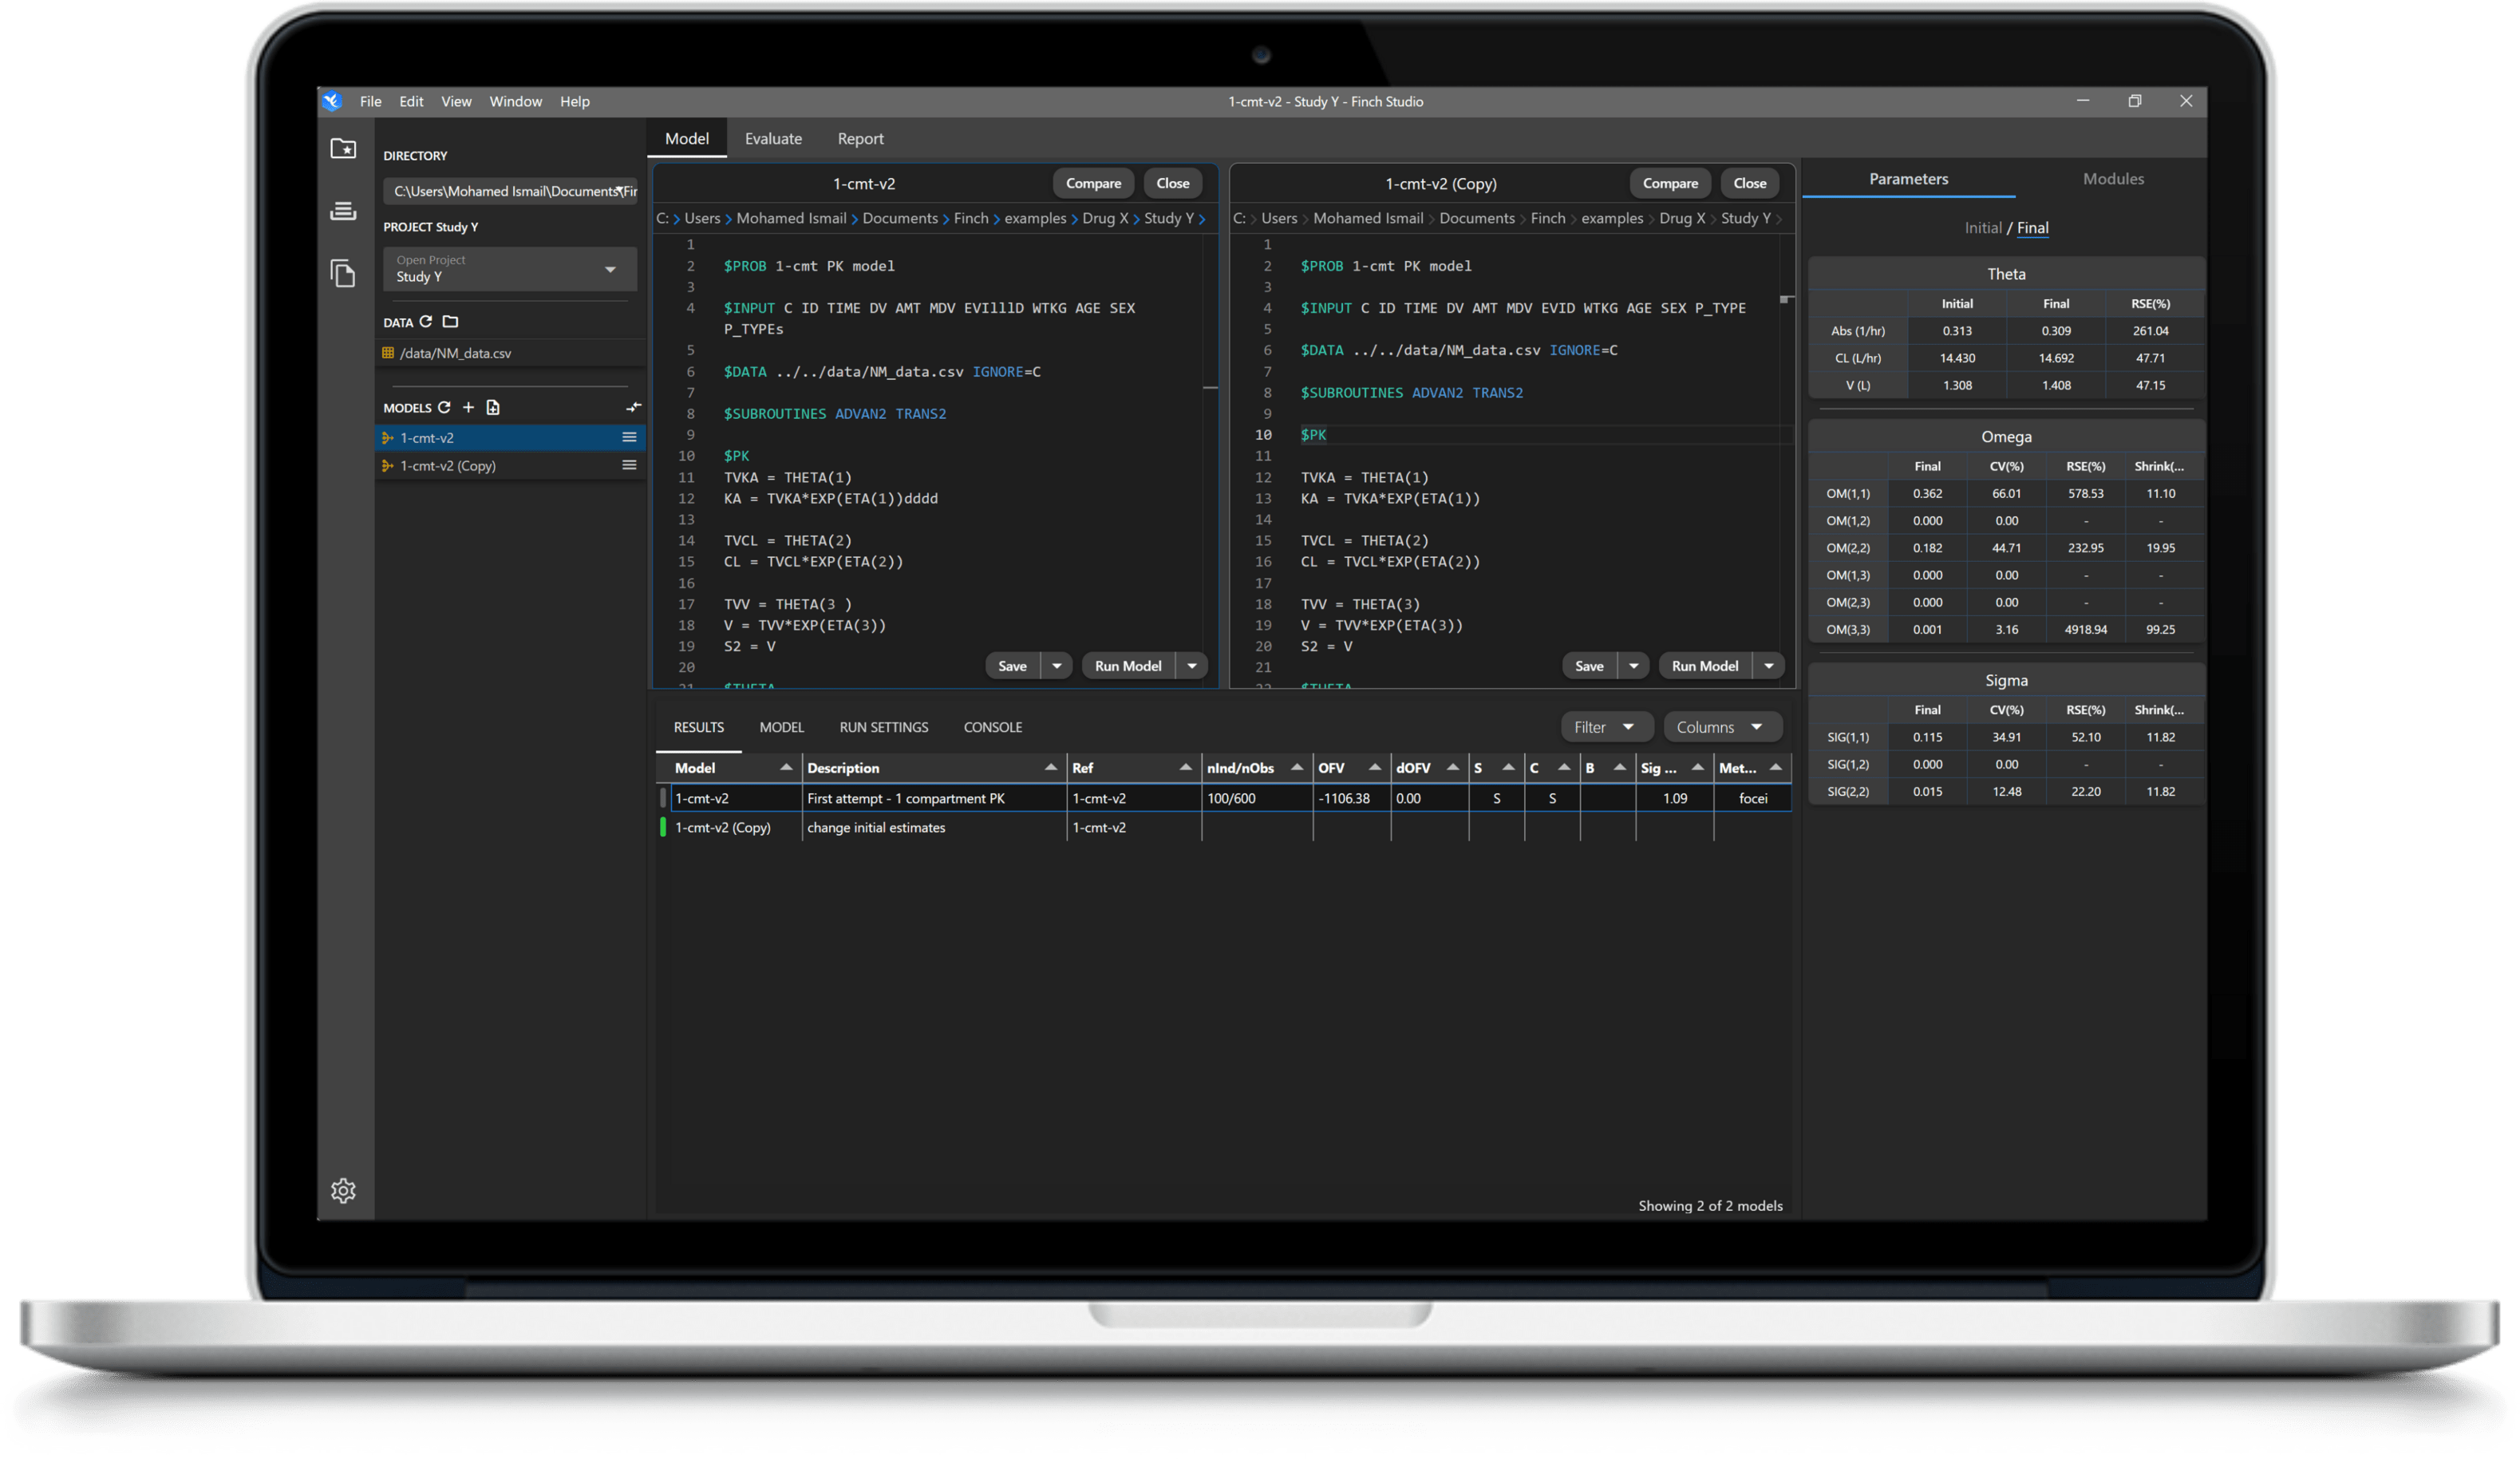
Modeling Workbench
Open and edit models side-by-side, view results and parameters from model runs, and quickly iterate and improve model performance using duplication helpers and the Finch model library.
Keep all your model files, tables, figures, and scripts organized with the provided model directory infrastructure and when you're all done, output your final model files to a regulatory compliant directory structure.
For advanced users, integrate your favorite command-line tools with the built-in console.

Powerful Visualizations and Analytics
Be completely in tune with your data and model diagnostics with lightning fast visualizations that render instantaneously.
Explore and answer questions from the cross-functional team or regulatory agencies in seconds with the ability to split, filter, stratify, and color your data.
News and Updates
A Guide to Exposure-Response Plots
August 16, 2022
Visualizing the relationship between drug exposures and treatment response using R and ggplot.
Creating Statistical Summary Tables in Finch Studio
July 19, 2022
A brief tutorial on creating statistical summary tables in Finch Studio
Automatic Time Binning for Population Pharmacometric Analyses in R
June 20, 2022
Using the Ckmeans.1d.dp package to perform automatic 1-dimensional data binning.
Strategies for Visualizing Hysteresis in PK/PD Data
June 7, 2022
Visualizing hysteresis using ggplot.
Creating A Dual-Axis Plot using R and ggplot
May 20, 2022
A brief tutorial on plotting two y-axes in ggplot

